


On August 15, Bitcoin’s price faced a correction along with the broader market, while the S&P 500 and DOW continued to build on their strong gains over the past four weeks. The Dow managed to surpass its 200-day moving average for the first time since April 21, potentially indicating to bullish investors that the market has reached its low point.
Despite facing high inflation and a continuous stream of interest rate increases, the equity markets have displayed remarkable strength. However, some traders are cautious, viewing the current 32-day uptrend in the DOW and S&P 500 as potentially a bear market rally.
The upcoming release of the Federal Open Market Committee (FOMC) meeting minutes on August 17 should provide further insight into the Federal Reserve’s perspective on the US economy and potentially reveal details about the next interest rate hike.
Over the past month, traders on Twitter have noticed a trend where cryptocurrencies like Bitcoin, Ether (ETH), and altcoins tend to sell off before FOMC meetings and then rally after the interest rate announcement aligns with investor expectations.
This short-term market dynamic has led some investors to speculate that the Fed might change its current strategy of interest rate hikes and quantitative tightening once inflation reaches its peak. While this may present opportunities for day-traders, it’s essential to acknowledge that inflation currently stands at 8.5%, significantly above the Fed’s 2% target.
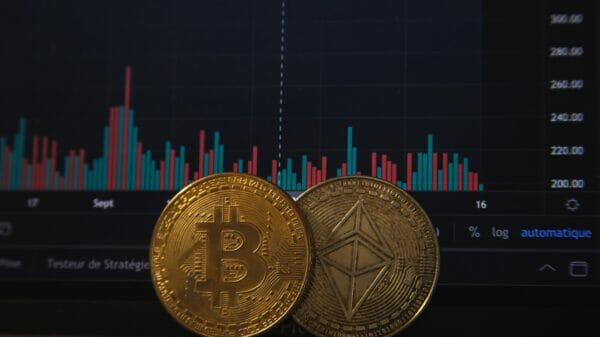
Bitcoin’s price often exhibits a strong correlation with the S&P 500, highlighting the importance for investors to remain open-minded and monitor the performance of the equity markets without being swayed by biased narratives.
Bitcoin Faces Resistance at Multi-Month Trendline
During the weekend, Bitcoin made a notable move as it broke through a multi-month descending trendline and crossed the $24,000 mark. This move was anticipated by many traders to trigger an upward momentum, potentially leading to a VPVR gap fill between $28,000 and $29,000.
$BTC really looked like it was going to go last night – and now we have 2x outside brewing pic.twitter.com/gkyLodiXi6
— Cheds (@BigCheds) August 15, 2022
Trader Cheds observed that Bitcoin seemed poised for a significant move, but the selling pressure at the resistance level resulted in what is known as an “outside bar,” hinting at a potential trend stall and the need to watch for signs of further weakening.
Bitcoin’s Bollinger Bands are also constricted, a sign that a directional move is imminent but we’ve already seen expansion into the top band at the $25.6K trendline resistance. Is a $22.4K retest next before $BTC attempts to grind higher? Few have mentioned the falling wedge… pic.twitter.com/wi1VpGt2y7
— Big Smokey (@big_smokey1) August 15, 2022
Another trader known as “Big Smokey” noted that Bitcoin’s Bollinger Bands were narrowing, indicating an impending directional move, with Bitcoin approaching the multi-month descending trendline.
There are some signs that a strong directional move is on the cards for Bitcoin: Super Guppy is getting real tight, possibly provoking a 26% pop to $28K before more sideways chop or downside to grab what will be new liquidity at the $24K s/r re-test by then… pic.twitter.com/1VgAkjj10o
— Big Smokey (@big_smokey1) August 15, 2022
Big Smokey suggested that a breakout above the descending trendline could lead to a substantial price increase, potentially up to $28,000, before a possible retest of the $24,000 level.
Most altcoins also followed Bitcoin’s movement by experiencing slight losses after encountering similar overhead resistance levels. However, some altcoins showed signs of bottoming out, indicating potential reversal patterns.
Related: Shiba Inu eyes 50% rally as SHIB price enters ‘cup-and-handle’ breakout mode
Market Dynamics and Potential Corrections
Interesting observations were made by traders on Crypto Twitter, suggesting that the significant gains seen in meme tokens like Shiba Inu (SHIB) and Dogecoin (DOGE) signaled an over-extended bullish phase that might lead to a correction.
Pulled this from the archives.
One year apart, same sector, different breed.
Time is a flat circle. pic.twitter.com/QplWWT43R5
— Hsaka (@HsakaTrades) August 14, 2022
Following substantial rallies of 130% and 42.5% in Ether and BTC, respectively, both assets appeared primed for profit-taking, especially at key resistance levels. Despite the open interest in these assets being near all-time highs, it remains uncertain what could trigger Bitcoin to break out or break down from the multi-month declining trendline.
Various factors like a 1% rate hike, stricter crypto regulations, or unexpected shifts in the equity markets could potentially lead to a price drop towards yearly lows. Conversely, a successful implementation of the Ethereum Merge could act as a positive catalyst, resulting in a surge in trading volumes beyond Bitcoin’s crucial resistance level.
The opinions expressed in this article are solely those of the author and do not represent the views of Cointelegraph.com. It’s important to conduct thorough research before making any investment or trading decisions.
Image Credit: Momentum Ronnarong / Shutterstock